
Surface fractures
No surface rupture occurred in the 12 January earthquake. This page describes road cracks and fissures near the surface projection of the fault.
23 January Report updated 30 March 2010
Following route 200 west of Port au Prince one encounters numerous rock falls in the marine cliffs 50 -100 m inland from the present shoreline, which the road follows. The road itself is fractured parallel to the shore especially in road-fill through swamps. In the month following the earthquake the offset of several of these cracks increased. One in ten concrete frame structures were damaged near Carrefor. In Leogane structural collapse occcured to one in three structures and in some blocks collapse was total.

Fig 1. Rock falls on road near Carrefor viewing west.
The road curves south at the end of the peninsula west of Port-au-Prince near Legane, and in the 3 km south of the Leogane junction towards DuFort 65 cross-road fractures are encountered. They occur north of the westward projection of the pronounced E-W trending valley near the epicenter.
Road Fractures Dufort to Leogane

Fig.2 View to NW with motorbike straddling fracture across Hwy 2 with deep tension gashes parallel to road (18.4733,-72.6322). Click on photo for additional view to north. Click here for view to north showing bulge in road. Photos below are representative of the 20 or more east-west cracks that cross the road both 1 km north and 1 km south of this feature (above photo courtesy Mike Hutchinson).
The road from Leogane to Dufort is constructed upon an embankment about 1-3 m above banana plantations and tall grasses. The swamp-like soils do not record fractures but in a couple of locations cracks extended through dry ground, village walls and courtyards to the east and west of the road. The road-fill employs local limestone aggregate and is surfaced by 4-10 cm of tarmac. In Fig.2 the approach-fill to a culvert sags about 50 cm for 30 m towards, and on each side of, a small stream. The culvert that fords the stream appears as a raised block roughly 5 m wide that has has been fractured on each side both transverse and parallel to the road. In january a hastily assembled warning sign advertised "Dan je", due to the perceived hazard from 300 m of road cracking to the south, however, the sign had been removed in February. The bulk of the road-parallel collapse consists of longitudinal spalling of road fill which shows tension gashes down to 2 m.
Representative photos of the road fissures are shown below the numerical data presented here. They were photographed January 26th but had not changed when inspected March 26th. All cracks were measured including some that were hairline with less than 1 mm of displacement.
 Fig 3 The above figure shows the distribution of 65 cracks vs distance northward. Compressional cracks are truncated in this figure. Low red dots are culverts. The two higher red dots are fissures that were traced into field beyond the road.

Fig 4 Histogram of maximum lengths of observed unfractured road segments. The dominant unfissured segment length is 12-24 m.
In March 2010 the shear offset, vertical offset and opening, or estimated closing, of fissures was measured on each side of the 5 m wide road and summed to search for an underlying deformation signal, should one exist. Damage was intense in the approach fill to culverts and bridges (see fig. 5) and should be ignored. In contrast, there is a consistant counterclockwise rotation of the road. This is revealed by the 11 cm of additional extension of the eastern edge of the road relative to its western edge.
 Fig 5 The cumulative sinistral offset of fissures (blue line) is 32 cm, ignoring road damage near culverts. This is equivalent to a shear strain of 1 x 10E-4. The mean extension of the road as revealed by the cracks is 1.5 x10E-4 strain. The underlying assumption in these estimates is that the road tarmac has not been itself shortened during the coseismic shaking.
A directed search near coordinates at 18.45461, -72.64049 (to inspect an en-echelon shear feature identified by Yann Klinger) and southward to the levee of the west-flowing river proved fruitless. Upift of a c.10 km wide region is indicated by corals now exposed near the coast a few km to the west. The predominance of tension gashes with rare compression or pounding, and its association with coastal uplift is consistent with an upwarped, sheared x post-seismic surface.
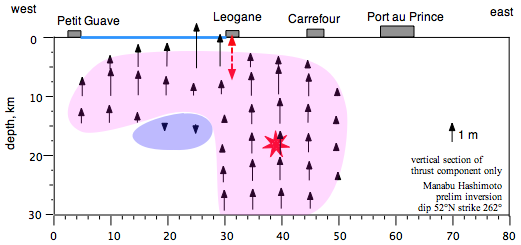
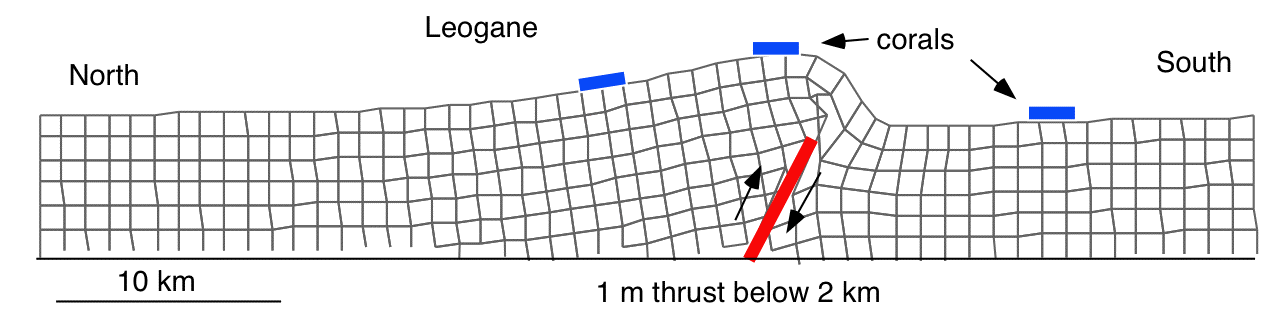
Cartoon to illustrate road cracking and coral uplift on hanging wall of buried oblique thrust fault. If we assume the road surface to be brittle the cumulative opening of >45 cm in 3 km is equivalent to 150 microstrain of north south extension. (computed using Coulomb 2.6 and Manabu Hakimoto's preliminary inversion from PALSAR data from early February 2010).

Above: Rare compressional crack (view west). Garmin handheld GPS unit for scale.
The most prominent of these fractures was followed 40 m to the east, through a totally destroyed house and wall (which showed no evidence for lateral offset), and 30 m to the west along a side road, before it disappeared into tall vegetation. i.e. it is probable that the road cracks are not superficial cracking of the road fill, but associated with primary lurching or faulting of the sediments of the river plain here.

Above: Extension 1 cm, sinistral displacement 3 cm. This fracture extended at least 30 m on each side of the road through sediments but with no evidence for strike-slip.

Extension 2.5 cm sinistral displacement 2 cm at 18.46675,-72.63308

Extension 2.5 cm, sinistral displacement 2 cm at 18.46897,-72.63295.